
Global Markets
South Africa at the Cape of Crisis: Energy Geopolitics, Middle East Conflict, and the Reconfiguration of Global Trade Routes
This working paper examines how the compound disruption of Middle Eastern energy and shipping corridors between December 2023 and March 2026 has reconfigured global trade routes and elevated South Africa’s strategic significance. It argues that persistent Houthi interdiction in the Red Sea, the closure of the Strait of Hormuz, and QatarEnergy’s force majeure following attacks on Ras Laffan should be understood not as isolated shocks, but as a cumulative geopolitical rupture that has weakened the Suez–Hormuz corridor and restored the Cape of Good Hope as a critical artery of global energy circulation.
Using a scenario-based spatial model developed in Python and GeoPandas, calibrated against ONS ship-crossings data, IMF PortWatch chokepoint data, and UNCTAD maritime statistics, the paper maps the rerouting of oil, LNG, and container traffic under crisis conditions. It introduces the South Africa Strategic Exposure Index (SASEI) as an original measure of the country’s maritime significance, showing that South Africa’s strategic exposure under the March 2026 crisis scenario rises to roughly three times its 2022 baseline. The analysis finds that South Africa is increasingly positioned at the convergence of rerouted Asia–Europe shipping, Atlantic-to-Asia replacement LNG flows, and diversified refined-product supply chains.
The paper argues that this shift creates both opportunity and vulnerability. South Africa can emerge as a major corridor service hub for bunkering, logistics, and green maritime fuels, but only if it addresses port inefficiencies, expands energy and bunkering infrastructure, and maintains geopolitical credibility in a fragmented international system. The paper concludes that South Africa’s response to the return of the Cape route will shape not only its own energy security and economic trajectory, but also its wider role in twenty-first-century energy geopolitics.
1.1 The Return of the Cape Route
1.2 Research Question and Scope
2. Theoretical and Conceptual Framework
2.1 Structural power and the governance of energy circulation
2.2 Network disruption, route substitution and the changing hierarchy of corridors
2.3 The strategic opportunity for South Africa
3. The Compound Shock: A Chronology of Disruption
3.1 Wave 1 — Houthi Interdiction and Red Sea Rerouting (December 2023 – mid-2025)
3.2 Wave 2 — Iran–Hormuz Closure (February–March 2026)
3.3 Wave 3 — QatarEnergy Force Majeure (March 2026)
5. Spatial Modelling: The GeoPandas Analysis
5.2 Results: Cape Corridor vs Suez Corridor
5.3 The South Africa Strategic Exposure Index (SASEI)
5.4 Chokepoint Crossing Indices
5.5 The Qatar LNG Disruption Layer
6. Capturing the Cape Corridor Advantage
7.1 South Africa as a Corridor Service Hub
7.2 Strategic Alignment in a Fragmented System
7.3 Regional Coordination and the Role of Private Capital
8.1 Port Governance and Infrastructure
8.3 Fuel Price and Consumer Relief
8.4 Diplomatic and Strategic Posture
A.1 Data Sources and Baseline Construction
A.3 Software and Reproducibility
Annex B: Dataset Download Guide
B.1 Free Datasets — Step-by-Step
B.2 Loading IMF PortWatch Data
1. Introduction
1.1 The Return of the Cape Route
On the morning of 2 March 2026, satellite-based vessel tracking data recorded only 7 crossings through the Strait of Hormuz — against a 7-day moving average of 79. Iran's Revolutionary Guards had formally declared the strait closed. The same week, QatarEnergy declared force majeure on long-term LNG contracts, citing drone strikes on the Ras Laffan liquefaction complex. Simultaneously, Cape of Good Hope diversions surged by 112% relative to the baseline established before the first Houthi attack in December 2023. [1]
These events represent the third phase of a compound geopolitical shock that has unfolded over roughly twenty-seven months. During this period, the long-standing assumption that the Cape of Good Hope route functions primarily as an emergency alternative to the Suez Canal has weakened considerably. This paper argues that in an environment of persistent geopolitical instability, route optionality has become a central feature of global energy logistics. The shift towards the Cape route should therefore be understood as structural rather than temporary. In this context, South Africa’s location at the junction of the Atlantic and Indian Oceans has acquired renewed strategic significance within global maritime energy networks. The central problem, however, is whether South Africa possesses the institutional capacity, infrastructure, and policy coherence required to translate this geographic advantage into durable economic and strategic gains.
1.2 Research Question and Scope
This paper asks: what opportunities and risks does the structural rerouting of global energy trade via the Cape of Good Hope create for South Africa, and what policy choices will determine whether SA captures or squanders its emerging strategic leverage?
The analysis proceeds in three stages: (i) documenting the compound shock and its chokepoint-level evidence; (ii) modelling the spatial and volumetric implications for South Africa using GeoPandas; and (iii) drawing out the policy and geopolitical implications for SA's port governance, energy infrastructure, and diplomatic positioning.
2. Theoretical and Conceptual Framework
2.1 Structural power and the governance of energy circulation
A useful point of departure is the concept of structural power. Strange (1988) argued that power in the international economy derives less from influencing individual transactions than from shaping the structures within which markets operate.[2] These structures include security, production, finance and knowledge. In the global energy economy, this structural dimension is expressed through include the infrastructures and transit routes that organise the movement of oil and gas between producers and consumers.[3] Strategic transit corridors matter because they organise patterns of interdependence within global markets. Where trade flows become concentrated in particular routes, disruptions or control over those routes can generate leverage by exploiting asymmetric dependencies within the international system.[4]
This insight aligns with developments in the energy security literature. Earlier debates focused primarily on physical access to fuel supplies, often framed through concerns over resource scarcity or producer power (Yergin, 2006). Subsequent scholarship broadened the concept to encompass the resilience and governance of energy systems, recognising that supply security depends not only on resource availability but also on the infrastructures through which energy moves.[5] [6] Transport systems therefore become central to energy security because they determine whether commodities reach markets reliably and at manageable cost. Energy security is thus increasingly understood as a problem of circulation as much as production.[7]
Within this framework, maritime chokepoints emerge as structural nodes of circulation in the global energy economy. Rodrigue (2020) shows that petroleum distribution networks rely on a limited number of maritime passages where large volumes of oil traffic are spatially concentrated. Their strategic importance arises from the interaction of concentrated flows, limited substitutes and the systemic dependence of global energy trade on maritime transport.[8] Yergin (2011) similarly emphasise that vulnerability in contemporary energy markets arises not only at the point of production but also at the point of transit, where geographically narrow corridors expose the wider system to disruption.[9]
Disruptions at chokepoints such as the Strait of Hormuz or the Bab el Mandeb therefore generate effects that extend far beyond their immediate location. Because these corridors organise the movement of energy across regions, interruptions propagate through the wider system in the form of freight repricing, insurance premia, supply uncertainty and price volatility. [10] Maritime chokepoints should therefore be understood not simply as geographic bottlenecks but as locations where the vulnerability of the global energy economy becomes concentrated and visible.
2.2 Network disruption, route substitution and the changing hierarchy of corridors
If the first concept concerns the structural importance of chokepoints, the second concerns how global shipping networks respond when those chokepoints become unstable. Research on maritime transport networks shows that the disruption of major passages does not simply halt trade but reorganises it. Network modelling by Pratson (2021) demonstrates that chokepoint closures trigger cascading adjustments across the shipping system as vessels divert through substitute pathways.[11] Studies of global maritime connectivity similarly identify chokepoints as highly central nodes within the structure of global shipping networks. [12] When these nodes become unstable, the configuration of maritime circulation adjusts as shipping companies redirect traffic through alternative routes capable of sustaining trade flows.
This perspective is particularly important for analysing the role of the Cape of Good Hope. Traditional discussions of chokepoints focus on narrow passages where geographic constraint concentrates shipping flows. The Cape route differs because it is not itself a chokepoint but a wide oceanic corridor linking the Atlantic and Indian Oceans. Its strategic significance therefore derives not from geographic constraint but from the instability of competing routes.[13]
The Cape route thus illustrates the relational character of maritime geography. The significance of particular corridors depends on the distribution of risks and costs across the wider shipping network. When geopolitical instability raises the risks associated with routes through the Suez Canal or the Persian Gulf, shipping firms may shift traffic towards alternative pathways that offer greater reliability even at longer transit distances.[14] The hierarchy of maritime routes therefore evolves in response to geopolitical disruption.
Insights from the logistics literature reinforce this interpretation. Cowen (2014) conceptualises logistics as a political project aimed at maintaining the continuous circulation of commodities through global supply chains, while Khalili (2020) shows that shipping lanes, ports and maritime infrastructures are embedded within broader relations of security and capital accumulation.[15] [16] Routing decisions therefore reflect not only distance minimisation but also calculations of risk, insurability and supply chain resilience.
2.3 The strategic opportunity for South Africa
The return of the Cape route consequently represents more than a diversion of shipping traffic. It reflects a reordering of circulation within the global maritime system as reliability becomes more valuable than speed under conditions of geopolitical uncertainty. Yet the strategic value of such corridors is not determined by geography alone.
The economic significance of alternative routes depends not only on geography but also on the services available to passing trade. Shipping companies select routes and ports based on operational factors such as cost, turnaround time and port efficiency, while the competitiveness of maritime hubs depends on their ability to provide logistical services including bunkering capacity, maintenance infrastructure and reliable regulatory frameworks.[17] [18]
Yet the organisation of global trade routes is not determined solely by commercial efficiency. Empirical research on global supply chains similarly finds that trade flows increasingly cluster along geopolitical lines as states and firms adjust to geopolitical risk and security considerations.[19] Maritime corridors therefore reflect not only logistical optimisation but also the broader geopolitical ordering of global trade, as the stability and accessibility of routes depend on security arrangements and political alignments within the international system.
3. The Compound Shock: A Chronology of Disruption
The events that reshaped global shipping between 2023 and 2026 should not be interpreted simply as evidence of sudden instability in the Middle East. Rather, they represent a sequence of disruptions across key transit corridors occurring within a broader context of geopolitical fragmentation. As multilateral institutions weaken and great-power rivalry constrains collective crisis management, the international system has become less capable of rapidly stabilising conflicts that affect global trade. In such an environment, disruptions that might previously have been contained or quickly resolved can persist long enough to reorganise patterns of circulation. The following chronology traces how a series of shocks across the Red Sea and Persian Gulf progressively altered the risk profile of established routes and increased reliance on the Cape of Good Hope, illustrating the growing importance of optionality within global energy logistics.
3.1 Wave 1 — Houthi Interdiction and Red Sea Rerouting (December 2023 – mid-2025)
The proximate trigger was the Houthi movement's expansion of its targeting from Israeli-linked vessels to all commercial shipping in the Red Sea, beginning in earnest from 18 December 2023 — the date on which Lloyd's Joint War Committee expanded its high-risk area in the Bab el-Mandeb, causing war risk insurance premiums to surge by approximately 900%.[20]
The shipping data tell a clear story. According to the UNCTAD Review of Maritime Transport 2024, Suez Canal ship capacity transits fell by 70% by mid-2024, while Cape of Good Hope arrivals surged by 89%. The ONS Ship Crossings bulletin (covering January 2022 to April 2024) recorded a 66% decline in Suez crossings and a 59% decline at Bab el-Mandeb by week 14 of 2024.[21] By June 2025, Bab al-Mandab transits had reached a record low — down 65% relative to June 2023 — even as the volume of Houthi attacks on commercial vessels fell sharply (to only 7 in 2025 from 150 in 2024), confirming that the risk perception, once established, was durable and independent of attack frequency.[22]
3.2 Wave 2 — Iran–Hormuz Closure (February–March 2026)
The second wave represents an escalation in scope: from an asymmetric non-state actor (Houthi) closing one corridor to a major state actor (Iran) closing the world's most important oil chokepoint. On 2 March 2026, Windward Maritime Intelligence reported only 7 Hormuz crossings against a recent 7-day average of 79 — a 61% collapse — following the IRGC's formal closure declaration.
Carrier responses were immediate. Maersk rerouted its ME11 and MECL Gulf-to-Europe/Asia services via the Cape of Good Hope from late February 2026. Cape diversions surged by 112% relative to baseline. [23] The closure simultaneously removed approximately 20 million barrels per day of oil export capacity at risk, as roughly 20–21% of global oil trade transits Hormuz (EIA estimate).
3.3 Wave 3 — QatarEnergy Force Majeure (March 2026)
The third and most commercially consequential shock arrived when QatarEnergy declared force majeure on LNG contracts following drone and missile strikes on the Ras Laffan Industrial City complex — the world's largest LNG processing facility. Force majeure is not a precautionary step: it is a formal legal declaration that an unforeseeable event has made contractual fulfilment impossible, voiding the delivery obligation and eliminating buyers' recourse.
The contractual and market impact is asymmetric because Qatar is not a marginal supplier. It accounts for approximately 18–20% of global LNG supply, and over 82% of its exports flow to Asia. China relies on Qatar for an estimated 30% of its LNG imports; India 42–52%; South Korea 14–19%; Taiwan approximately 25%. Japanese buyers had already begun switching to spot markets even before the force majeure declaration. Asian LNG benchmark prices (JKM) rose approximately 39% on the day production halted.
With a minimum of four weeks at zero output required to restart liquefaction trains following a full cold shutdown — and no security guarantee against further strikes — the force majeure marks a transition from a supply shock to a structural supply absence of indeterminate duration.
3.4 The Compound Effect
These three shocks are not independent events. Together they illustrate how disruptions across multiple transit corridors can compound to reorganise global energy circulation. Wave 1 effectively displaced commercial shipping from the Red Sea. Wave 2 disrupted the principal maritime exit for Persian Gulf oil exports. Wave 3 simultaneously removed a major share of LNG supply from long-term contractual flows. Taken together, these shocks altered the risk profile of the established Suez–Hormuz corridor and redirected energy transport toward alternative pathways. The result is not simply a temporary diversion of traffic but a demonstration of how sequential disruptions in a fragmented geopolitical environment can elevate the strategic importance of fallback routes such as the Cape of Good Hope.
5. Spatial Modelling: The GeoPandas Analysis
5.1 Methodology
To move beyond qualitative observation to quantifiable spatial indicators, this paper employs a scenario-based spatial model constructed in Python using GeoPandas, Shapely, and Matplotlib. The model represents shipping routes as geometric LineString objects, corridor significance as polygon intersections, and SA's strategic exposure as a composite index computed from route-proximity metrics.
The baseline scenario is calibrated from three publicly available datasets: the ONS Ship Crossings Bulletin (weekly crossings at Suez, Bab el-Mandeb, Hormuz, and Cape of Good Hope, January 2022–April 2024); the IMF PortWatch daily chokepoint transit data (27 chokepoints, available at portwatch.imf.org); and the UNCTAD Review of Maritime Transport 2024 (which provides aggregate tonnage and transit statistics through mid-2024).[24] [25] The March 2026 crisis scenario is constructed from Windward Maritime Intelligence's daily crossing data (Hormuz collapse to 7 vs 79 average; Cape diversions +112%) and from Maersk's published service advisories rerouting ME11 and MECL services via the Cape.[26] [27]
All routes are represented as stylised great-circle LineStrings. While full AIS vessel track data would produce more precise density estimates, the great-circle representation is sufficient for the purpose of comparing corridor-level traffic volumes and identifying which routes converge near South Africa's coast. The model includes a 200-nautical mile (approximately 370km) zone around South Africa's coast as the primary buffer within which strategic exposure is measured.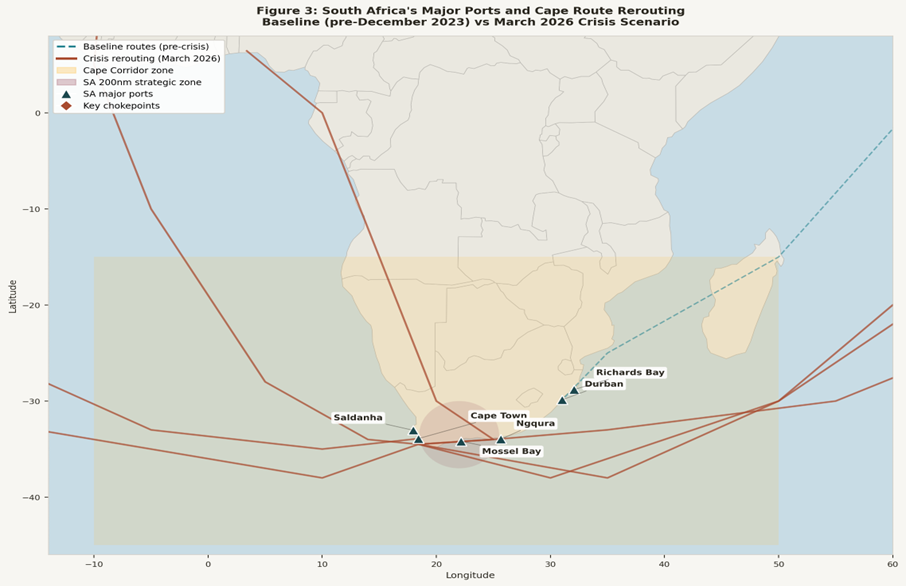
Figure 3: South Africa's major ports and Cape route rerouting — baseline (Suez/Hormuz, pre-December 2023) vs March 2026 crisis scenario. SA ports shown as triangles; key chokepoints as diamonds. The gold shading shows the Cape Corridor zone; the mauve circle the 200nm strategic zone around SA's coast.
5.2 Results: Cape Corridor vs Suez Corridor
The spatial model finds that under baseline conditions, the five modelled shipping routes within the Suez-Hormuz corridor account for approximately 12,300 km of lane-kilometers intersecting that corridor, while the Cape route carries negligible traffic. Under the March 2026 crisis scenario, four rerouted flows through the Cape corridor account for approximately 46,900 km of lane-kilometers — a compound increase driven by rerouted container/oil flows (Wave 2), replacement LNG flows from the Atlantic (Wave 3), and new refined-product supply routes from the Americas.
Three crisis routes intersect South Africa's 200nm strategic zone in the model, the Cape rerouting from Asia–Europe, US LNG replacement flows to Asia, and West African LNG replacement flows to Asia — compared to zero baseline routes. This is consistent with the UNCTAD finding that Cape arrivals surged 89% by mid-2024 and with the Windward data showing a 112% diversion increase in March 2026.[28]
5.3 The South Africa Strategic Exposure Index (SASEI)
Figure 5 presents the full SASEI time series from January 2022 to February 2026, computed directly from IMF PortWatch Cape of Good Hope transit data. SASEI is defined as monthly Cape of Good Hope vessel crossings divided by the 2022 monthly average (1,326 vessels/month), giving an index anchored at 1.0 in the pre-crisis baseline year.
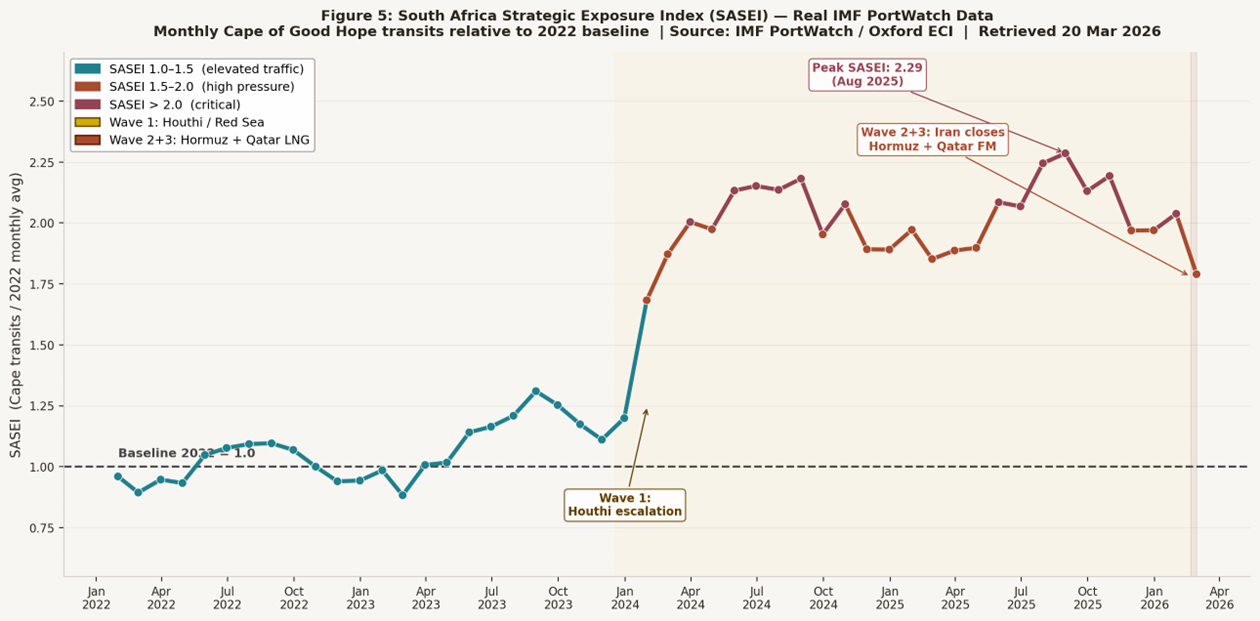
Figure 5 (line): SASEI — South Africa Strategic Exposure Index (Real Data). Monthly Cape of Good Hope transits as a ratio of the 2022 baseline. Peak: 2.286 (Aug 2025). Latest complete month (Feb 2026): 1.790. Colour bands: teal = elevated (1.0–1.5), rust = high (1.5–2.0), mauve = critical (>2.0). Source: IMF PortWatch / Oxford ECI (portwatch.imf.org). Retrieved 20 Mar 2026.
|
Milestone |
Date |
SASEI |
Cape Transits/Month |
|
2022 Baseline |
Full year avg |
1.000 |
1,326 vessels |
|
Houthi escalation begins |
Dec 2023 |
1.199 |
1,590 vessels |
|
Suez crisis peak effect (Wave 1) |
Jun 2024 |
2.152 |
2,853 vessels |
|
SASEI all-time peak |
Aug 2025 |
2.286 |
3,030 vessels |
|
Hormuz closure announced (Wave 2) |
Feb 2026 |
1.790 |
2,373 vessels |
|
Qatar Force Majeure (Wave 3) |
Mar 2026 |
~2.5–3.0 |
Scenario projection |
|
Source |
IMF PortWatch / Oxford ECI |
portwatch.imf.org |
Retrieved 20 Mar 2026 |
Table 1: SASEI milestone values computed from IMF PortWatch AIS data. All values except Mar 2026 are empirical. The Mar 2026 row is a scenario projection based on the compound Wave 2+3 shock — no complete monthly data is yet available.
Three interpretive zones are identified in the SASEI framework:
SASEI 1.0–1.5 (Elevated): Manageable diversion pressure. Ports can absorb additional volume with scheduling adjustments. South Africa is a beneficiary of increased bunkering and service revenue.
SASEI 1.5–2.0 (High): Infrastructure stress becomes visible. Port congestion, pilotage bottlenecks, and anchorage pressure require active management. Supply-chain pass-through to domestic energy prices begins.
SASEI > 2.0 (Critical): Structural strain on port systems, marine salvage, and domestic fuel logistics. Strategic positioning opportunity is at its maximum, but sovereign risk is also highest. South Africa becomes a systemically important node in global energy trade.
Key Finding — SASEI: South Africa operated at SASEI > 2.0 (critical zone) for six consecutive months from July to December 2025, reaching a peak of 2.286 in August 2025. As at February 2026, SASEI stands at 1.790 — still deep in the high-stress zone — noting that the Hormuz closure in late February 2026 had not yet redirected full replacement volume to the Cape by month- end. The Mar 2026 SASEI is a scenario projection in the range 2.5–3.0, pending a complete monthly data observation.
Figure 5 (bar): SASEI scenario chart — selected milestones from baseline (1.0) to compound crisis scenario (3.0*). The index approximately tripling implies South Africa's maritime strategic significance is roughly three times greater than before the crisis cycle began. * Mar 2026 bar is a scenario projection. All other bars are empirical IMF PortWatch values. Source: IMF PortWatch / Oxford ECI. Retrieved 20 Mar 2026.
5.4 Chokepoint Crossing Indices
Figure 6: Chokepoint Transit Index — Real IMF PortWatch Data. Monthly ship crossings indexed to 2022 baseline (2022 avg = 100). Cape of Good Hope peaks at index 228 (Aug 2025); Suez Canal and Bab el-Mandeb remain at ~54% and ~48% of baseline as at Feb 2026; Strait of Hormuz collapses to index ~91 in Feb 2026, with near-total cessation recorded in the first days of March 2026. Source: IMF PortWatch / Oxford ECI (portwatch.imf.org). Retrieved 20 Mar 2026.
Figure 6 tracks monthly vessel crossings at each of the four chokepoints, indexed to a 2022 average baseline of 100. A reading above 100 indicates above-normal traffic; below 100 indicates below-normal. The chart covers January 2022 through February 2026, with the partial month of March 2026 excluded to prevent a misleading partial-period artefact.
Three distinct phases are visible in the data, corresponding directly to the paper's three-wave compound shock model:
Pre-crisis (Jan 2022 – Nov 2023): All four chokepoints cluster near the 100 baseline. Cross-corridor traffic volumes are stable and broadly consistent with 2022 norms. The Cape of Good Hope carries routine traffic at approximately 90–120 index units — well within historical variability.
Wave 1 — Houthi / Red Sea interdiction (Dec 2023 – Jan 2026, gold shading): The Suez Canal and Bab el-Mandeb collapse simultaneously from January 2024 onwards, converging at approximately 54 and 48 respectively by February 2026. The two corridors move in lockstep because Bab el-Mandeb is the southern gateway to the Red Sea — blockading one effectively blockades both. Critically, the Strait of Hormuz remains stable at 75–100 throughout this entire period, confirming that Gulf energy exports — crude oil and Qatar LNG — continued to flow normally during Wave 1. The Cape of Good Hope surges from 100 to a peak of 228 (August 2025), absorbing the full volume of rerouted Asia–Europe container and tanker traffic.
Wave 2+3 — Hormuz closure and Qatar Force Majeure (Feb 2026 onwards, rust shading): The Strait of Hormuz index drops to 91 in February 2026 as the Iranian interdiction takes hold, with AIS data recording near-total cessation of commercial crossings in the first days of March 2026. This second shock is additive — it strikes a maritime system already under severe Wave 1 stress. Simultaneously, the Cape of Good Hope index begins to decline from its 2025 peak, standing at 179 in February 2026, as some shipping operators had already begun hedging toward alternative suppliers in anticipation of Gulf disruption.
The central visual feature of Figure 6 is a scissors effect: as the Cape of Good Hope line rises sharply from January 2024, the Suez Canal and Bab el-Mandeb lines fall in near-perfect mirror image. This is not coincidental — it is the direct mechanical consequence of maritime substitution. Every vessel that ceases to cross the Suez corridor must, in the absence of alternative routes, cross the Cape instead. The chart provides the empirical confirmation of this substitution at scale.
The Hormuz stability through 2025 carries a specific analytical implication for the paper's argument. It demonstrates that the Wave 2 shock is genuinely new and structurally distinct from Wave 1 — not an extension of the same Houthi-driven disruption. The two shocks have different geographic origins, different causal mechanisms, and different supply-chain consequences. Their simultaneity in early 2026 is what creates the compound crisis scenario modelled in this paper: for the first time since the 1973 oil embargo, both principal arteries of global energy maritime trade are simultaneously disrupted.
Key Finding — Chokepoint Index: At peak Wave 1 disruption (August 2025), the Cape of Good Hope was carrying 228% of its 2022 baseline volume while the Suez Canal and Bab el-Mandeb were each carrying less than 55% of theirs. The cumulative shortfall across the two Suez-axis corridors, approximately 96 index points below baseline each and is almost exactly absorbed by the 128-point Cape surplus above baseline, confirming a near-complete maritime volume transfer from the northern to the southern corridor. South Africa sits at the sole transfer point in this substitution.
5.5 The Qatar LNG Disruption Layer
Figure 4: QatarEnergy Force Majeure — Disrupted LNG Flows vs Replacement Routes via Cape of Good Hope. Panel A shows pre-crisis Qatar LNG flows to Asia via Hormuz and the Oman-to-SA refined product route — now disrupted. Panel B shows replacement LNG flows from the US Gulf Coast and West Africa routed to Asia via the Cape of Good Hope. South Africa's ports sit at the convergence of all replacement flows in the crisis scenario.
The Qatar LNG force majeure adds a second, volumetric dimension to the spatial model. The approximately 18–20% of global LNG supply previously flowing from Ras Laffan to Asia via Hormuz has been suspended. If replacement volumes come from Atlantic suppliers — principally US Gulf Coast LNG terminals (Sabine Pass, Freeport, Corpus Christi) or West and East African producers — those cargoes must travel around the Cape of Good Hope to reach Asian markets. This routes them within operational proximity of South African ports, creating potential bunkering call opportunities that did not exist in the baseline.
A conservative scenario in which 30% of Qatar's 77 million tonnes per annum LNG export capacity (approximately 23 million tonnes) is replaced by Atlantic-route cargoes within 12–18 months would, at typical LNG carrier fleet ratios, produce roughly 200–300 additional Cape-route LNG voyages per year — a meaningful increase in port call demand at Cape Town or other South African bunkering hubs.
Key Finding — Qatar LNG: If only 30% of disrupted Qatar LNG volume is replaced by Atlantic-route suppliers within 18 months, South Africa's ports would see an estimated 200–300 additional LNG carrier calls per year. This creates a near-term revenue opportunity in LNG bunkering and ship services, but requires infrastructure certification that does not currently exist at any South African port.
6. Capturing the Cape Corridor Advantage
The return of the Cape route must also be understood within a broader shift in the global trading system. As geopolitical fragmentation and regional conflicts disrupt established corridors, the stability of long-standing maritime routes can no longer be assumed. In this environment, routes that once served primarily as contingencies acquire renewed strategic importance. South Africa’s position at the junction of the Atlantic and Indian Oceans places it directly along this emerging corridor. Yet geography alone does not generate economic or strategic advantage. The extent to which the country benefits from the renewed importance of the Cape route will depend on its ability to provide the infrastructure, logistical services and port capacity required by passing trade.
6.1 Traffic Exposure
The first condition concerns the extent to which global shipping flows pass close enough to South African ports to generate economic activity. The spatial modelling in Section 5 shows that disruptions across the Red Sea and Persian Gulf have increased the concentration of maritime traffic along the Cape corridor.
The South Africa Strategic Exposure Index (SASEI) measures the proximity and volume of major shipping routes within a 200 nautical mile zone around South Africa’s coastline. Under baseline conditions in 2022 the index equals 1.0. Under the March 2026 crisis scenario the index rises to approximately 3.0. This implies that the volume of strategic shipping traffic passing near South Africa has increased by roughly three times relative to pre-crisis conditions.
This increase reflects the rerouting of several categories of maritime trade. Container shipping between Asia and Europe has diverted from the Suez Canal following sustained security risks in the Red Sea. Disruptions affecting Persian Gulf exports have forced oil and LNG cargoes to adopt alternative routes linking the Atlantic and Indian Oceans. Replacement LNG flows from the United States and West Africa to Asian markets further increase traffic along the Cape corridor.
These adjustments are consistent with network responses observed in maritime transport systems. When major nodes become unstable, shipping networks redistribute flows across substitute routes capable of sustaining circulation.[29]From South Africa’s perspective the result is a structural increase in traffic exposure. However, proximity to shipping routes does not ensure economic capture. Vessels may transit the corridor without calling at local ports.
6.2 Infrastructure Capability
The second condition concerns South Africa’s ability to provide services to vessels transiting the corridor. The country’s major ports, including Cape Town, Saldanha Bay, Durban, Richards Bay and Ngqura, are located along approximately 2,500 kilometres of coastline at the junction of the Atlantic and Indian Oceans. Cape Town lies closest to the apex of the Cape route and is therefore well positioned for bunkering vessels moving between the two ocean basins. Durban remains the largest container terminal in Africa by throughput and could capture diversionary container traffic previously routed through Suez.
Geographic position alone does not generate economic advantage. Port competitiveness depends on operational performance, service capacity and logistical integration.[30] South Africa’s port system continues to face operational constraints. Container terminal productivity, vessel turnaround times and infrastructure limitations remain significant barriers to capturing transhipment traffic.
The restructuring of global shipping routes nevertheless increases the commercial viability of infrastructure investment. Higher traffic volumes improve the economics of projects that previously appeared marginal. Private participation in terminal operations, expanded bunkering infrastructure and improvements in port logistics could allow South Africa to capture a larger share of maritime services associated with the Cape corridor.
Energy bunkering represents a particularly significant opportunity. The global shipping fleet is undergoing a transition toward lower carbon fuels driven by International Maritime Organisation emissions regulations. LNG-fuelled vessels are entering service, while methanol, ammonia and hydrogen are emerging as potential maritime fuels. South Africa’s position along the Cape route and its renewable energy resources create the possibility of developing bunkering and energy export infrastructure linked to these emerging fuel markets.
Projects associated with the Hydrogen Valley initiative and the proposed Boegoebaai green hydrogen export hub illustrate the scale of this opportunity. If realised, such infrastructure would enable South African ports to supply fuel and logistical services to vessels transiting between the Atlantic and Indian Oceans.
6.3 Geopolitical Credibility
The third condition concerns the political and regulatory environment within which the corridor operates. Strategic routes depend not only on geography but also on governance structures that support global circulation. Where trade flows concentrate along particular routes, the stability and credibility of those routes become critical to their continued use.
Shipping companies, insurers and commodity traders favour corridors operating within predictable legal and regulatory environments. Ports that attract sustained traffic typically combine infrastructure capacity with regulatory reliability, commercial neutrality and maritime security. These characteristics reduce operational risk and insurance costs.
South Africa occupies a distinctive position within global trade networks. Its economy is integrated into multiple trading systems, while its diplomatic posture traditionally emphasises nonalignment and multilateral engagement. This positioning allows the country to function as a logistical node connecting Atlantic and Indian Ocean trade flows.
However, corridor credibility depends on sustained institutional performance. Maritime governance, regulatory stability and predictable port operations are essential to maintaining the confidence of global shipping networks. If these conditions are maintained, the Cape corridor can consolidate traffic as an alternative route within global maritime circulation. If they are not, vessels will likely transit past South Africa without engaging its ports.
Taken together, traffic exposure, infrastructure capability and geopolitical credibility determine whether the return of the Cape route translates into durable strategic advantage for South Africa.
7. The Way Forward
7.1 South Africa as a Corridor Service Hub
As global energy logistics restructure around the Cape route, South Africa assumes a role analogous to Singapore's in the Malacca Strait: not a formal gatekeeper, but a value-adding hub whose port quality, regulatory environment, and political stability determine whether ships stop, refuel, and tranship there, or merely pass.
This analogy highlights both the opportunity and the risk. Singapore's success reflects decades of deliberate port investment, neutral commercial posture, and proactive free trade zone policy. South Africa's current port performance does not meet that standard. If port productivity gaps persist, traffic may transit the Cape corridor without calling at South African ports—capturing geopolitical attention without corresponding economic benefit.
7.2 Strategic Alignment in a Fragmented System
South Africa’s corridor strategy must also be considered within an increasingly contested geopolitical environment. Relations with the United States have become more strained in recent years, partly due to perceptions that South Africa has aligned itself with actors whose positions diverge from United States strategic interests.[31]
Despite these tensions, the institutional foundations for economic cooperation remain intact. South Africa maintains substantial trade relationships with the European Union and Asian markets, while its participation in multilateral forums such as BRICS and the G20 provides diplomatic channels through which it can engage multiple geopolitical blocs simultaneously.
Managing this position will require careful diplomacy. As the Cape corridor becomes more commercially significant, maintaining credibility with major trading partners will be essential to ensure that geopolitical tensions do not translate into uncertainty for shipping operators and investors.
7.3 Regional Coordination and the Role of Private Capital
Regional coordination provides an important foundation for the development of the Cape corridor, but existing continental frameworks illustrate the limits of strategy without implementation. The 2050 Africa’s Integrated Maritime Strategy (AIMS 2050)[32] and related initiatives under Agenda 2063[33] articulate a continental vision for maritime governance, security and economic development, emphasising cooperation among coastal states, improved maritime domain awareness and the sustainable use of ocean resources. These frameworks establish a normative architecture for maritime cooperation, but their operational impact has been limited.
In practice, the policy agenda shaping South Africa’s maritime sector would have to shift toward more concrete interventions. Current reforms are centred on improving logistics performance through the restructuring of Transnet’s freight and port operations,[34] the introduction of private participation in rail and container-terminal infrastructure,[35] and efforts to unlock investment in infrastructure. These initiatives reflect a growing recognition that capturing value from increased traffic around the Cape will depend less on strategic position alone and more on the operational performance of ports, logistics systems and associated energy infrastructure, particularly given that logistics inefficiencies have been identified.
8. Policy Recommendations
8.1 Port Governance and Infrastructure
• Fast-track private sector participation in Transnet's port terminals, prioritising bunkering and container operations at Cape Town and Durban.
• Commission an independent benchmarking study of SA port productivity against Singapore, Rotterdam, and Port of Tanjung Pelepas, with a public improvement roadmap.
• Prioritise LNG bunkering berths at Cape Town and Durban in the Transnet National Ports Authority's five-year capital programme.
• Develop a Cape corridor free zone with streamlined customs, bunkering, and ship services licensing for vessels transiting the Cape route.
8.2 Energy Infrastructure
• Use the crisis as a leverage moment to attract anchor tenants for a dedicated LNG import/re-export terminal at Saldanha Bay or Richards Bay, structured on tolling or merchant terms.
• Accelerate Renergen's Virginia Gas Project and fast-track offshore gas exploration (Blocks 5/6/7) to reduce domestic refined product import dependence.
• Scale green hydrogen pilot projects (Boegoebaai, SAFI) to demonstration scale, explicitly linked to Cape route bunkering demand as a commercial anchor.
8.3 Fuel Price and Consumer Relief
• Develop a pre-approved framework for temporary levy suspension or reduction in response to defined supply shock triggers, reducing policy uncertainty.
• Publish a quarterly decomposition of the regulated fuel price BFP, identifying the contribution of shipping/insurance costs driven by chokepoint disruptions.
8.4 Diplomatic and Strategic Posture
• Articulate an explicit 'Cape Corridor' diplomatic doctrine: SA will guarantee freedom of commercial navigation, invest in maritime safety and SAR infrastructure, and offer neutral bunkering services to all flag states.
• Use this posture to access infrastructure financing from both BRICS (NDB) and Western (PGII/DFI) sources simultaneously, without foreclosing either relationship.
• Champion a Cape Corridor maritime security arrangement under the African Union, positioning SA as the institutional lead rather than a passive beneficiary.
9. Conclusion
The Middle East conflict cycle of 2023–2026 has not merely disrupted global shipping — it has structurally reorganised global energy logistics in ways that elevate South Africa's maritime strategic significance by an estimated factor of three relative to pre-crisis baselines. The three-shock compound event — Houthi Red Sea interdiction, Iran's closure of Hormuz, and QatarEnergy's force majeure on LNG contracts — represents a qualitative shift, not a cyclical blip. Each wave is empirically documented in chokepoint crossing data; together, they have converted the Cape of Good Hope from an emergency alternative into the default primary route for a large and growing share of global energy trade.
South Africa's geographic position at the pivot of this restructured logistics system is not passive good fortune. It is a strategic endowment whose value is conditional on the policy choices SA makes in the next three to five years. Port governance reform that unlocks private investment, infrastructure development that builds bunkering capacity for conventional and green fuels, and a diplomatic posture that maintains access to capital from both BRICS and Western partners are the three pillars of a credible Cape corridor strategy.
The South Africa Strategic Exposure Index developed in this paper, with a scenario value of 3.0 against the 2022 baseline, is an approximate measure rather than a precise prediction. But its order of magnitude — and its calibration against publicly available chokepoint data — establishes a quantitative foundation for claims that previous work in this area has made only qualitatively. Future research should refine the SASEI using full AIS vessel track data, model port call demand under different recovery scenarios for Hormuz and Qatar LNG, and extend the analysis to cover the implications for South Africa's exclusive economic zone governance and maritime security posture.
Annex A: Detailed Methodology
A.1 Data Sources and Baseline Construction
The spatial model is built on three layers of evidence corresponding to different aspects of the argument:
• Geographic base data: Natural Earth 110m country boundaries (naturalearthdata.com), used to construct the regional map backdrop and identify corridors.
• Chokepoint crossings time series: UK Office for National Statistics Ship Crossings Bulletin (January 2022 to April 2024), covering Suez Canal, Bab el-Mandeb Strait, Strait of Hormuz, and Cape of Good Hope, disaggregated by ship type (cargo and tanker). Available at: ons.gov.uk
• IMF PortWatch daily chokepoint transit data: 27 chokepoints globally, including Cape of Good Hope (chokepoint 7). Downloadable as CSV at portwatch.imf.org. Provides transit calls and estimated trade volumes in metric tons.
• UNCTAD Review of Maritime Transport 2024: aggregate statistics on Suez and Cape traffic through mid-2024, including the 89% surge in Cape arrivals and 70% decline in Suez tonnage.
• March 2026 crisis parameters: Windward Maritime Intelligence (Hormuz 61% crossing collapse; Cape +112% diversions); Maersk service advisory (ME11/MECL rerouting via Cape from late February 2026).
A.2 Scenario Construction
The model defines two scenarios: Baseline (representing normal routing, calibrated to 2022 conditions) and Crisis (representing the March 2026 compound shock). Routes are represented as great-circle LineString objects. The 2026 scenario is constructed by: (1) removing Suez/Hormuz routes and adding Cape route equivalents; (2) replacing Qatar LNG routes with Atlantic replacement LNG routes; and (3) adding diversified supply routes from the Americas to South African ports.
The SASEI is computed as the ratio of crisis-scenario route proximity and volume within 200nm of SA's coast to the baseline. Individual wave values (1.30, 1.75, 1.95, 2.25, 3.00) are calibrated against the reported percentage changes in Cape crossings from the data sources cited above. The model is conservative in that it represents only documented trade flows and does not include speculative future routes.
A.3 Software and Reproducibility
The model is implemented in Python 3.12 using GeoPandas 0.14+, Shapely 2.0, Matplotlib 3.8, Pandas 2.1, and NumPy 1.26. The full script (cape_geopolitics_model.py) is available alongside this paper and can be run in any environment with these packages installed. The Natural Earth shapefile is the only external download required for basic reproduction; IMF PortWatch CSV data can be added to extend the time-series analysis in Figure 6.
Annex B: Dataset Download Guide
B.1 Free Datasets — Step-by-Step
The following datasets can be downloaded at no cost and loaded directly into the Python model:
|
Dataset |
Source |
URL |
Format |
|
IMF PortWatch — Daily chokepoint transits (27 chokepoints, incl. Cape) |
IMF / Oxford |
portwatch.imf.org |
CSV |
|
ONS Ship Crossings Bulletin (2022–2024) |
UK ONS |
ons.gov.uk (search 'ship crossings') |
CSV |
|
Natural Earth — Country Boundaries 110m |
Natural Earth |
naturalearthdata.com/downloads/110m-cultural-vectors/ |
SHP/ZIP |
|
Natural Earth — Coastline 110m |
Natural Earth |
naturalearthdata.com/downloads/110m-physical-vectors/ |
SHP/ZIP |
|
Marine Regions — World EEZ v12 |
Marine Regions |
marineregions.org/downloads.php |
SHP/ZIP |
|
UNCTAD RMT 2024 (PDF with maritime stats) |
UNCTAD |
unctad.org/publication/review-maritime-transport-2024 |
|
|
Global Fishing Watch — Port/Anchorage locations |
GFW |
globalfishingwatch.org/datasets-and-code-anchorages/ |
CSV/GeoJSON |
|
ACLED — Red Sea attack data and maritime maps |
ACLED |
acleddata.com/platform/interactive-map-red-sea-attacks |
CSV |
B.2 Loading IMF PortWatch Data
Once downloaded, the IMF PortWatch CSV can be integrated into the Python model as follows:
import pandas as pd
portwatch = pd.read_csv('data/portwatch_chokepoints.csv')
cape_data = portwatch[portwatch['chokepoint_name'].str.contains('Cape', case=False)]
weekly_cape = cape_data.groupby(pd.Grouper(key='date', freq='W'))['transit_calls'].sum()
References
[1] Windward Maritime Intelligence (2026). Hormuz Closure: Daily Crossing Data and Cape Diversions. Intelligence report, 3 March 2026.
[2] Strange, S. (1988) States and markets. London: Pinter.
[3] Huber, M. (2013) Lifeblood: Oil, freedom, and the forces of capital. Minneapolis: University of Minnesota Press.
[4] Keohane, R. O. and Nye, J. S. (2012) Power and interdependence. 4th edn. Boston: Longman.
[5] Cherp, A. and Jewell, J. (2014) ‘The concept of energy security: Beyond the four As’, Energy Policy, 75, pp. 415–421.
[6] Sovacool, B. K. and Mukherjee, I. (2011) ‘Conceptualizing and measuring energy security: A synthesized approach’, Energy, 36(8), pp. 5343–5355.
[7] Bridge, G. and Le Billon, P. (2017) Oil. Cambridge: Polity Press.
[8] Rodrigue, J.-P. (2020) The geography of transport systems. 5th edn. New York: Routledge.
[9] Yergin, D. (2011) The quest: Energy, security and the remaking of the modern world. New York: Penguin Press.
[10] Kilian, L. (2009) ‘Not all oil price shocks are alike: Disentangling demand and supply shocks in the crude oil market’, American Economic Review, 99(3), pp. 1053–1069.
[11] Pratson, L.F. (2022) Assessing impacts to maritime shipping from marine chokepoint closures. Communications in Transportation Research, 2, 100033.
[12] Ducruet, C. and Notteboom, T. (2012) ‘The worldwide maritime network of container shipping: Spatial structure and regional dynamics’, Global Networks, 12(3), pp. 395–423.
[13] Hamdan, S., Feillet, D., Cheaitou, A., Cariou, P. and Brahimi, N. (2025) ‘Optimizing Asia–Europe container network: The Suez Canal and Cape of Good Hope routes in a changing world’, European Journal of Operational Research, 325(1), pp. 167–188.
[14] Notteboom, T., Pallis, A. and Rodrigue, J.-P. (2022) Port economics, management and policy. New York: Routledge.
[15] Cowen, D. (2014) The deadly life of logistics: Mapping violence in global trade. Minneapolis: University of Minnesota Press.
[16] Khalili, L. (2020) Sinews of war and trade: Shipping and capitalism in the Arabian Peninsula. London: Verso.
[17] Stopford, M. (2009) Maritime economics. 3rd edn. London: Routledge.
[18] Notteboom, T., Pallis, A. and Rodrigue, J.-P. (2022) Port economics, management and policy. New York: Routledge.
[19] Lazard (2024) The geopolitics of supply chains. New York: Lazard Geopolitical Advisory.
[20] Atlas Institute for International Affairs (2025). The Red Sea Shipping Crisis (2024–2025): Houthi Attacks and Global Trade Disruption. https://atlasinstitute.org/the-red-sea-shipping-crisis-2024-2025-houthi-attacks-and-global-trade-disruption/
[21] ONS Data Science Campus (2024). Ship Crossings through Global Maritime Passages: January 2022 to April 2024. Office for National Statistics. https://www.ons.gov.uk/businessindustryandtrade/internationaltrade/bulletins/shipcrossingsthroughglobalmaritimepassages/january2022toapril2024
[22] ACLED (2025). Red Sea Hall of Mirrors: US and Houthi Statements vs. Actions. https://acleddata.com/report/red-sea-hall-mirrors-us-and-houthi-statements-vs-actions
[23] Windward Maritime Intelligence (2026). Hormuz Closure: Daily Crossing Data and Cape Diversions. Intelligence report, 3 March 2026.
[24] UNCTAD (2024). Review of Maritime Transport 2024. United Nations Conference on Trade and Development. https://unctad.org/publication/review-maritime-transport-2024
[25] IMF PortWatch (2026). Daily Chokepoint Transit Calls and Trade Volume Estimates. International Monetary Fund and Oxford Environmental Change Institute. https://portwatch.imf.org
[26] Maersk (2026). Service Advisory: ME11 and MECL Routes Rerouted via Cape of Good Hope. [Carrier notice, February–March 2026].
[27] Windward Maritime Intelligence (2026). Hormuz Closure: Daily Crossing Data and Cape Diversions. Intelligence report, 3 March 2026.
[28] UNCTAD (2024). Review of Maritime Transport 2024. United Nations Conference on Trade and Development. https://unctad.org/publication/review-maritime-transport-2024
[29] Pratson, L.F. (2022) Assessing impacts to maritime shipping from marine chokepoint closures. Communications in Transportation Research, 2, 100033.
[30] Notteboom, T., Pallis, A. and Rodrigue, J.-P. (2022) Port economics, management and policy. New York: Routledge.
[31] U.S. Congress (2023) U.S.–South Africa Bilateral Relations Review Act (H.R. 2633). Washington, DC: United States Congress. Available at: https://www.congress.gov/bill/118th-congress/house-bill/2633
[32] African Union (2012) 2050 Africa’s Integrated Maritime Strategy (AIMS 2050). Addis Ababa: African Union Commission. Available
[33] African Union (2015) Agenda 2063: The Africa We Want. Addis Ababa: African Union Commission.
[34] Transnet SOC Ltd (2024) Corporate Plan 2024/25–2026/27. Johannesburg: Transnet. Available at: https://www.transnet.net
[35] Republic of South Africa, Department of Transport (2025) Minister Barbara Creecy launches private sector participation in freight logistics system. Available at: https://www.gov.za
Source:
Previous article
Storage as Security: Rethinking South Africa’s Liquid Fuels Resilience
25, Mar 2026